
22 Hard questions for those who believe CO2 is causing climate change
Suppose you’re interested in helping preserve/improve the environment and you also think it would be good to help humans, especially poor people, millions of whom die each year from inhaling indoor smoke. Assuming you’re interested in the climate issue, then before you try to just stop oil, ask yourself a few questions.
Question 1: The most important question
Here’s a question you should answer before you spend any time on energy policy: Why do you think eliminating human-emitted CO2 is more important than eliminating poverty? Why should we spend trillions of dollars to try to reduce CO2 in the atmosphere a bit (or prevent it from increasing) and spend far less money helping poor people reach the middle class? Don’t people take better care of the environment when they are fed and safe? Don’t they stop cutting down forests when they have natural gas in their kitchens?
This is not a straw-man question. You’re either focused on decarbonization or you’re focused on poverty. The outcomes are different. You can’t just say “Decarbonization helps solve poverty.” I don’t think that’s true, and no one has yet shown it to be true. Decarbonization raises energy prices, hurting poor people. So pick your battle - which do you choose and why?
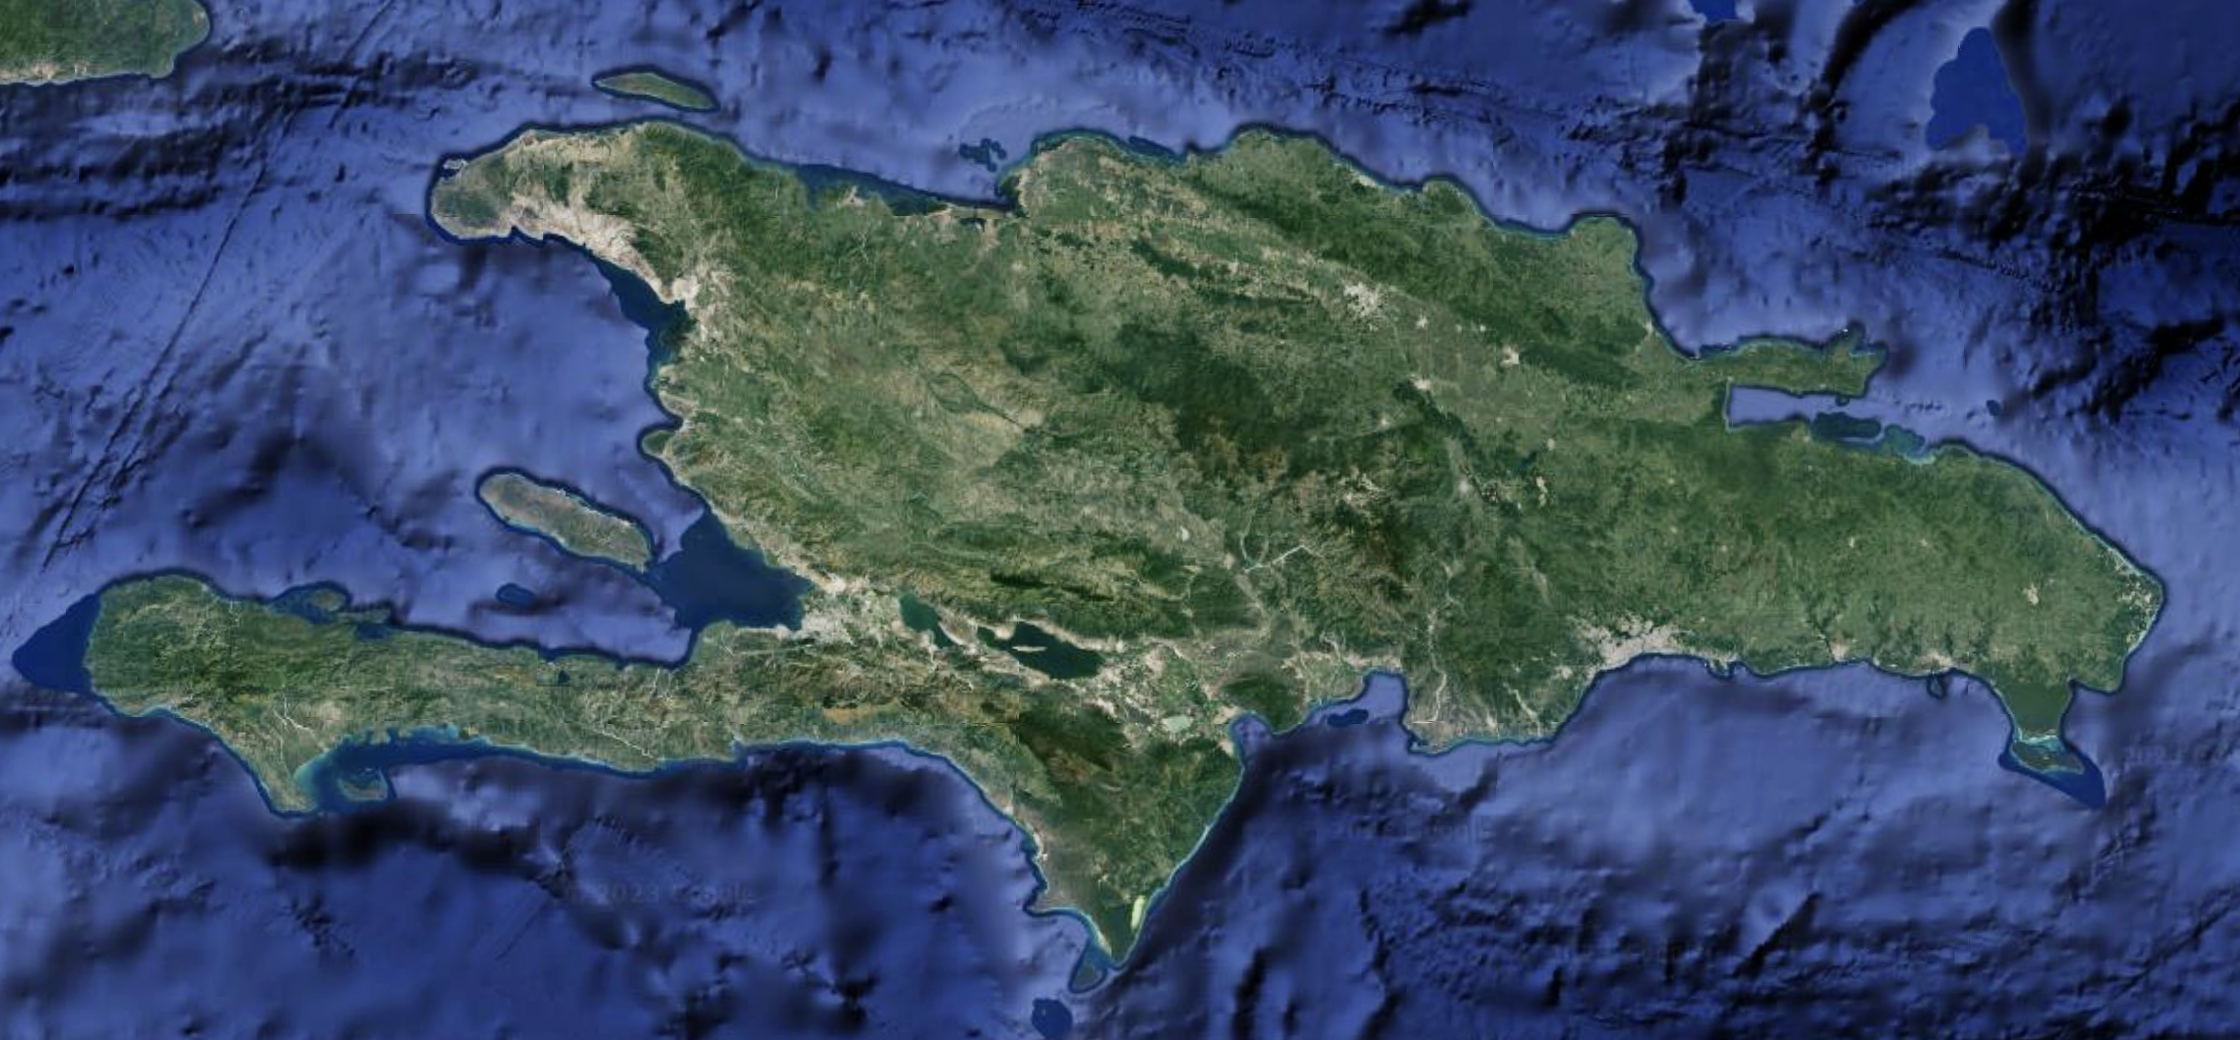
I just took this Google Earth snapshot of Haiti and the Dominican Republic. Can you see the border between these two countries? I’ll give you a hint: the Dominican Republic government made a concerted effort in the 1990s to get natural gas to every home, and Haiti didn’t.
Even if you assume CO2 is an existential threat, why have humans failed to reduce the evil gas since the big Paris agreement, despite spending more than $1 trillion per year?

Note the little black dot representing the Paris agreement, and the Covid pandemic’s effect. Not to mention volcanoes.
How many trillions of dollars will we have to spend to reduce CO2 by, say, ten percent, or at the very least stop it from increasing from here?
According to one group, the cost is around $2.7 trillion per year for the next 25 years.
What benefit, exactly, would we get for spending $67 trillion?
No one knows the answer to this question. It’s an important question, because $67 trillion is a lot of money. It could be used for other purposes, like helping the environment and people even more.
If you’re convinced we need to decarbonize based on models of future climate, you may want to listen to a climate-model expert discuss the uncertanties and biases of the IPCC models before you commit.
Are you still in favor of decarbonization? Assuming you think it’s worth preventing billions of people moving to the middle class to have some effect on future climate predicted by computer models, let’s go to the climate questions.
The basic assumptions
For reference, here is the CO2 curve for the northern hemisphere:

And, also for reference, here is the UAH average earth troposphere temperature graph measured by satellite every year since 1979:

That should be enough to question right there: if CO2 drives temperature, what’s the relationship between CO2 and those temperatures? Doesn’t look simple and obvious to me.
The basic principles
Keep three principles in mind when trying to understand earth’s climate:
The physics never changes. So if you claim increased CO2 is driving the increase in temperatures, then you must show how CO2 was driving climate for billions of years and how it drives climate over a period of months. You can’t say the physics only applies at certain times.
The details matter. If you say CO2 drives climate, and there is an obvious period from 2000–2015 where CO2 went up considerably and the earth’s average temperature didn’t change at all, and it happens again just a few years later, you can’t wave it away. You have to explain how your theory matches the data with a convincing degree of precision.
The greenhouse effect is instantaneous — it happens at roughly the speed of light. It’s driven by incoming solar radiation, so the theory is that the more incoming solar radiation combined with more CO2 produces more warming — instantaneously. You knew that, right?
Question 2: What drives the yearly temperature cycle?
The earth is closest to the sun in January, when it’s summer in Sydney and winter in New York. That’s because the earth’s orbit isn’t exactly round, and it isn’t centered:

Note that the earth is three million miles closer to the sun in January than in July, and that’s only a 1-percent difference in distance.
For the lower troposphere, where we get consistent satellite data for the planet as a whole, the coolest month is January at 263.18K and the warmest is July at 265.42K for a range of 2.24K. That is, the entire planet cools 2.2 degrees C from July to January, and it heats up 2.2 degrees from January to July. This is mostly because the northern hemisphere has far more land, which affects this temperature measurement significantly.
Now, let’s look at carbon. The Keeling curve of CO2 see-saws upward (as shown below). During the summer months, trees are growing, sucking in carbon. During the fall and winter, they are decaying, exhaling carbon dioxide. This is for the northern hemisphere:

Let’s review the facts:
In the Northern Hemisphere in July, temperatures are warmest when a) CO2 is being sucked out of the atmosphere by plant growth, and b) the earth is farthest from the sun.
In the Northern Hemisphere in January, temperatures are at their lowest when a) CO2 is being maximally released into the atmosphere by decay and b) the earth is closest to the sun.
Keep in mind the greenhouse effect works by delaying incoming solar energy at roughly the speed of light.
Question 2: What’s going on? Does CO2 have anything to do with temperature? Be sure to explain this in a way that supports your thesis that CO2 is causing warming on longer scales.
Question 3: Why isn’t the hottest day of the year the same as the day with the most sunlight?
Is’s easy to verify that the hottest week of the year in general in the Northern Hemisphere occurs in late July to mid August. Any number of datasets, like the National Center for Environmental Information climate tool will confirm this. Yet the longest day of the year — the day with the most amount of radiation that could be delayed by greenhouse gases and contribute to higher temperatures — occurs at the end of the third week in June.
Question 3: Why are temperatures higher when the days are shorter? Can you explain that using the hypothesis that CO2 drives temperature?Remember that as we add more CO2, we should see higher temperatures immediately, and if you think it’s all about water vapor feedback, you’ll need to show how water vapor peaks in late July to mid August around the globe. Be very specific about how this works.
Answer to question 3
The premise of the question contains a hidden assumption. The claim that the Northern Hemisphere is hottest in late July to mid-August is based on surface thermometer networks heavily weighted toward Northern Hemisphere land masses. It is not a measurement of the Earth system's total energy. Earth is actually at aphelion around July 4 — roughly 3 million miles farther from the sun than at perihelion in January — meaning the planet intercepts about 7% less solar radiation in July than in January. The planet as a physical system is receiving and absorbing less energy during the period land thermometers register as the hottest. This is the response of Northern Hemisphere land surfaces to axial tilt concentrating insolation on land-heavy latitudes. The temperature lag is a regional phenomenon, not a global one. Worth noting: the summer solstice peaks around June 21 and aphelion falls around July 4, meaning peak tilt-driven insolation and minimum distance-driven insolation occur within two weeks of each other, further emphasizing the peak in late June.
Once you accept that, the question answers itself. There is no global temperature peak in late July requiring explanation, and CO2 plays no role in the heat lag. The lag in hottest days across the continent varies systematically by location in ways that reveal the actual mechanism. Rural thermometers in the continental interior peak earlier, often late June to mid-July, because dry land has low heat capacity and responds quickly to less sunlight arriving as days shorten. East Coast locations peak later because they are coupled to the Gulf Stream, which transports warm water northward on a delay of weeks to months. West Coast locations follow a different schedule entirely, governed by Pacific sea surface temperatures and upwelling patterns that operate on different timescales and directions than the Atlantic. That geographic variation — same atmosphere, same CO2, completely different thermal calendars — is the fingerprint of ocean heat storage, gradients, and transport, not atmospheric composition. CO2 is a well-mixed gas with no mechanism to produce a spatially variable lag tied to ocean current geography. Increasing CO2 hasn’t changed the lag either.
Question 4: What Caused the Little Ice Age?
Was the Little Ice Age real? Was it worldwide? Andy May says yes, it was very real. I’ll let John Robson explain:
The following peer-reviewed summaries come from my climate-papers pages:
Role of the Radiation Factor in Global Climatic Events of the Late Holocene, Atmospheric and Ocean Physics — Izvestiya, Atmospheric and Oceanic Physics, 2022; Fedorov et al.
The Approaching New Grand Solar Minimum and Little Ice Age Climate Conditions — Natural Science, 2015; Nils-Axel Morner
Little Ice Age abruptly triggered by intrusion of Atlantic waters into the Nordic Seas — Science Advances, 2021; Lapointe & Bradley
The LIA was mostly recorded in Europe, where the thermometers and printing presses were. Keep in mind that most of the Southern Hemisphere is water. But there is more and more evidence that the LIA was worldwide, and only the absence of evidence to suggest it wasn’t.
If CO2 drives climate, if there is a dose response between CO2 and temperature, then we should see that in the CO2 record.
So let’s look at the most recent review of CO2 data from that period.
Revised records of atmospheric trace gases CO2, CH4, N2O, and δ13C-CO2 over the last 2000 years from Law Dome, Antarctica — Earth System Science Data, 2019; Rubino et al.
Here is another look, showing temperature in red and CO2 in black using ice-core data:

Just because we have it, I’m going to include a 2020 tree-ring analysis of temperature for the last 2,000 years, noting that it does not look anything like a hockey stick:

This is temperature only. I include it to show how warm the 3rd, 10th, and 11th centuries really were, and how cold the two little ice ages were.
These are the latest and best figures for CO2 from 0AD to 1900. What do they show? They show that CO2 rose during the Medieval warm period and fell during the Little Ice Age, but after temperature moved first, before CO2. This is Henry’s law in action: CO2 comes out of the oceans when they warm and goes into the oceans as they cool. CO2 does not drive temperature. CO2 follows temperature.
Question 4: Did a drop in CO2 cause the Late Antique Little Ice Age and the Little Ice Age, or did the Little Ice Ages cause a drop in CO2?
Question 5: What Caused the Holocene Temperature Stability?
Like the geocentric view of Medieval astronomers, you have to keep adding more and more complex mechanisms on top of each other to maintain your fundamental premise.

We are here to try to determine cause and effect. Look at the graph below. It shows temperature in red and CO2 in gray. 20,000 years ago, North America was under two enormous ice sheets, the Laurentide and the Cordillera. New York City was under a kilometer of ice. This was mostly driven by obliquity — the tilt of the earth’s axis. As the tilt started to go back toward upright, temperatures rose jerkily for the next 10,000 years. Note that in general CO2 lags temperature, usually by about 800 years. It’s not the driver.

But then something very strange happened. The earth’s temperature became very stable. While people today are anxious about every tenth of a degree, the temperature regime today is nothing like it was 20–10,000 years ago. If you just look within one 1.5 C plus or minus, it’s practically flat for the last ten millennia. In fact, earth’s average temperature has only risen two degrees Celcius since 1800 — well within the band set by the previous 10,000 years.
And just to dial in the relationship between CO2 and temperature, here is a reconstruction by Javier Vinos for the past 11,000 years. This is a close-up of the right-side of the previous graph. It’s within the stable band I’ve described, but it hardly shows a causal relationship for CO2 …

The IPCC doesn’t like to talk about the Holocene. It’s inconveniently missing from their documentation.
Question 5: What is the relationship of CO2 and temperature in the last 20,000 years? Explain how CO2 is the driver for this time period.
Question 6: What heats the oceans?
People talk about ocean heat and how increasing CO2 increases ocean heat. But even the IPCC recognizes that downwelling infrared-radiation from greenhouse gases (or anything) can’t penetrate the ocean skin, while direct shortwave radiation penetrates the oceans to a depth of 10 meters and more. Fifty percent of the sun’s energy enters the oceans this way — directly, not through downwelling IR — and cannot be increased by any amount of greenhouse gases. The only thing that heats the oceans is shortwave radiation, and that 50 percent drives ocean currents, oscillations, storms, el Nino, and melts an amount of ice each summer in the Arctic to equal the size of the United States.
Question 6: How does CO2 drive ocean heat? If it doesn’t, how are you proposing more CO2 drives climate?
Question 7: What about the Poles?
It seems common knowledge that more CO2 will raise the overall temperature on earth, despite evidence I and others continue to present to the contrary. But … what about the poles? Does adding more CO2 also raise temperatures in the Arctic or Antarctica?
Antarctic researchers say two things:
First, they discovered that the greenhouse effect works in reverse in Antarctica during winter, and in the Arctic as well, according to Holger Schmithusen of the Alfred-Wegener-Institut Helmholtz-Zentrum für Polar- und Meeresforschung. See his paper Antarctic Specific Features of the Greenhouse Effect: A Radiative Analysis Using Measurements and Models
By the way, Alfred Wegener was the guy who figured out that the earth’s crust is made of moving plates, but it took 50 years for the “scientific consensus” to stop resisting his idea, one that any grade-school student could see easily.
On the poles, there is also a peer-reviewed version in Geophysical Research Letters. From the abstract:
… for central Antarctica an increase in CO2 concentration leads to an increased long-wave energy loss to space, which cools the earth-atmosphere system. These unique findings for central Antarctica are in contrast to the well known general warming effect of increasing CO2. The work contributes to explain the non-warming of central Antarctica since 1957.
Antarctica has been gaining ice since 2020.
Both Antarctica and the Arctic are extremely dry. Eight dark months of the year, they are under inversion conditions, where the surface is colder than the air. This leads to an inversion of the greenhouse effect at both poles, because the greenhouse effect modifies the adiabatic lapse rate, which is reversed at the poles.
Second, the Arctic ocean is a heat-storage battery. Every summer, a huge amount of heat is transported north by storms. This extra energy melts more ice than direct sunlight does. This water is a form of energy storage, for when the sun goes down in September, that water begins to freeze. As it freezes, it releases energy to space. Much more energy goes to space during winter than arrives at the Arctic during summer.
Third, even though the Arctic is experiencing less cold winters (not summers), the Antarctic continent is not. Antarctica is protected by the Southern Ocean, which shows no signs of warming, and which will preserve the ice until the continents move enough to change the flow of currents. By then, the IPCC will no longer exist. I collect papers on Antarctica, feel free to browse them.
The IPCC knows that the greenhouse effect works in reverse at the poles (it’s buried in the report), but they don’t talk about it.
Question 7a: How does more CO2 at the poles cause cooling?
Question 7b: How, precisely, is CO2 causing Arctic and Antarctic melting today?
Question 8: What’s Causing all the Heating in the Arctic?
The Arctic is melting! We hear it all the time, we can’t get away from it. Here’s the average monthly Arctic sea-ice extent from the National Snow and Ice Data Center:
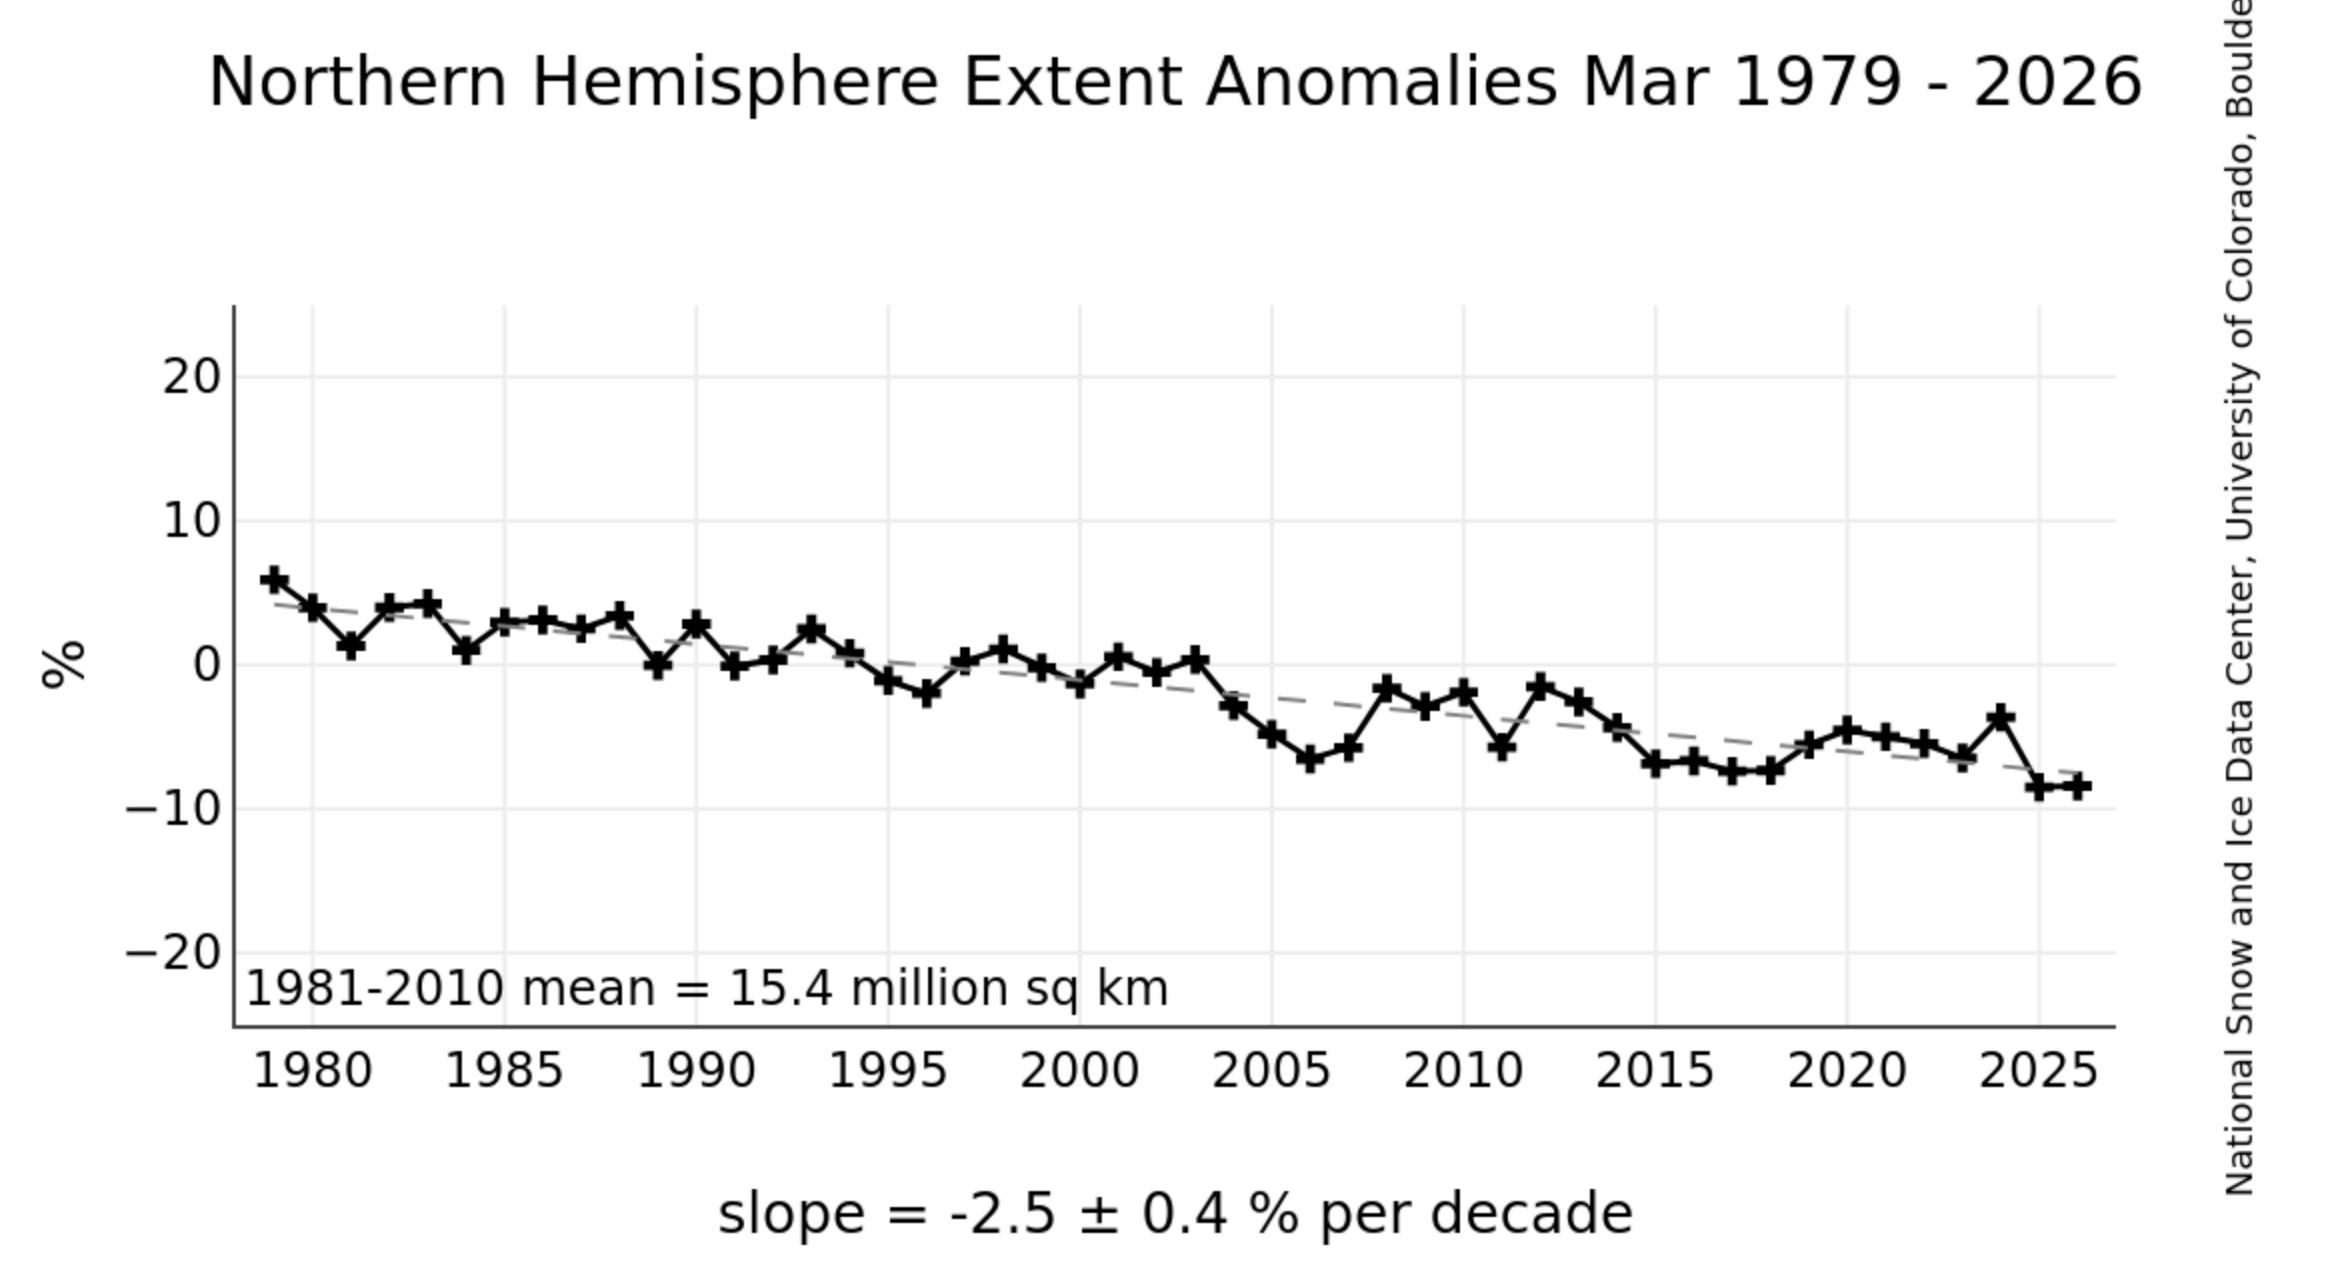
Yes, but that starts in 1979, so you’d expect something like that. Look carefully: since 2006, the ice volume has been flat.
That’s when CNN tells us that “New study warns Arctic sea ice vanishing sooner than predicted!” Yet as CO2 continues its relentless rise, the minimum summer Arctic sea ice extent hasn’t changed significantly since 2007, despite Arctic amplification.
Let’s break it down further. Charts that start in 1980 are going to show warming. Do we have any records going back before the 1980s? Why yes, the National Snow and Ice Center knows very well there is data from before that graph started.

Does that look bad to you? The September data causes people to worry and makes for good click-bait headlines, so that’s what the press likes to show. As we’ve just seen, even the summer ice refuses to continue its downward trend. And winters simply refuse to cooperate with the whole humans-are-melting-the-Arctic narrative.
Question 8: Is CO2 causing the ice to melt, or is it something else?
Hint: it’s not atmospheric, it’s storm-driven and ocean-driven heat moving from the tropics to the poles. Jim Steele explains:
Question 9: The Dansgaard Oeschger Events
Are temperatures rising faster than ever before? If you read the IPCC reports, as I do, you may have noticed that they present no data from about 10,000 years ago to 2,000 years ago. Andy May goes into detail on the lack of data for the holocene. Here I present the smoking gun, from the introduction to the AR6 Technical Summary published in 2021:
Paleoclimate evidence: The AR5 assessed that many of the changes observed since the 1950s are unprecedented over decades to millennia. Updated paleoclimate evidence strengthens this assessment; over the past several decades, key indicators of the climate system are increasingly at levels unseen in centuries to millennia and are changing at rates unprecedented in at least the last 2000 years. (Box TS.2, Section TS.2)
Okay, that proves it! All we have to do is go back 2,000 years and see that temperatures are rising faster than ever. Only two problems:
First, even in the past 2,000 years, you have to do extreme data manipulation to say temperatures have never been higher — naturally. That’s because urban heat is driving most of the temperature rise of the past 100 years or so. Here’s a look at the last 2,000 years, see if you can spot the fast rises in temperature (black line):

Each bar on the x axis is 25 years. I can count about eight times when temperatures went up by about half a degree in roughly 10–15 years. That’s far faster than the 1 degree C we we have seen in the last 100 years.
Second, is 2,000 years the end of history? Or did inconvenient things happen before then? Let’s look at this graph, which goes back about 50,000 years:
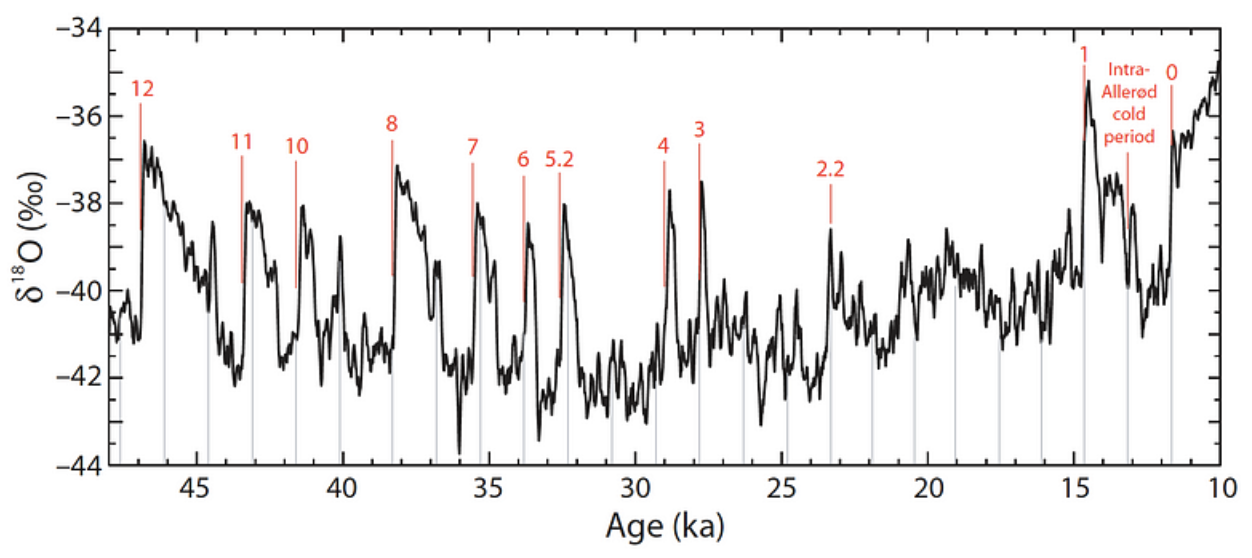
Numbered are the so-called Dansgaard-Oeschger events, which are the subject of many peer-reviewed papers. In this graph, there are 12 such warming events in the last 50k years, and the slopes of the lines are almost vertical. In one of these episodes, according to a 1999 paper titled Abrupt climate change at the end of the last glacial period inferred from trapped air in polar Ice in the journal Science:
Nitrogen and argon isotopes in trapped air in Greenland ice show that the Greenland Summit warmed 9 +/- 3 degrees C over a period of several decades, beginning 14,672 years ago. Atmospheric methane concentrations rose abruptly over a approximately 50-year period and began their increase 20 to 30 years after the onset of the abrupt Greenland warming.
Hmm. Nine degrees in a few decades. Nine degrees. Celcius. According to this peer-reviewed paper:
We find that both temperature and δ18O increased in two steps of 20 and 140yrs, with an overall amplitude of 11.80±1.8◦C between the stadial and interstadial centennial-mean temperature.
What’s that? TWELVE DEGREES in 140 years? Could this be why the IPCC doesn’t like to look further back than 2,000 years? This had to have been natural, and it wasn’t that long ago.
How do they happen? Once again, I will let Jim Steele explain:
Question 9: Why does the IPCC fail to mention previous rapid-warming events? They know all about these events. They mention Dansgaard-Oeschger events in their bibliographies but not in the text.
Could it be because they have an agenda driven by politics, rather than science?
Question 10: The tropical mid-troposphere warm spot
The IPCC makes predictions. Do they come true? Starting with James Hansen’s work in the late 1970s and early 1980s, “scientists” have been predicting that human emissions of CO2 are going to cause tropical mid-troposphere temperatures to rise. Successive IPCC reports kept doubling down on this prediction, until the Fifth report in 2018, which states:
Fourth, all models produce a maximum warming in the upper tropical troposphere that is not apparent in the observations and whose impact on detection results is difficult to quantify.
That sounds like the data don’t match the theory. Yet, they soldier on:
Nevertheless, all the studies indicate that anthropogenic factors account for a significant part of recent observed changes, whereas internal and naturally forced variations alone, at least as simulated by current models, cannot explain the observed changes. In addition, there are physical arguments for attributing the changes in the vertical profile of temperature to anthropogenic influence.
Ah, so if the data doesn’t agree with your prediction, then wave your hands, use big words, and just restate the hypothesis as if it were an outcome. This is exactly what they did in the most recent IPCC report:
It is very likely that human-induced greenhouse gas increases were the main driver of tropospheric warming since comprehensive satellite observations started in 1979 …
Question 10: Is it true? Is the tropical troposphere getting hotter as predicted?
John Robson breaks it down:
Question 11: Milankovitch Cycles
Look at the graph of CO2 and temperature for the last 800k years:

Clearly, there’s a correlation between CO2 and temperature at this scale. What’s going on?
Temperature is in red; CO2 is in blue. Look closely. Do you see temperatures moving first or CO2 moving first? Do you see more red on the left or blue on the left? Around 90 percent of the time, temperature moves first, followed by CO2 within years, decades, centuries. All researchers acknowledge there is a significant time lag and that CO2 follows temperature. However, there are two explanations of how this works:
Alarmists explain this away by saying that feedbacks dominate. They say yes, temperature changes as a result of orbital mechanics, but then feedbacks kick in and CO2 drives temperature afterward. Is that true? They don’t present any clear evidence of this cart-before-the-horse relationship.
Many scientists use Occam’s razor to come to a different conclusion: that orbital mechanics are actually driving temperatures on earth at this scale. CO2 simply follows temperature according to Henry’s law — going into the oceans when sea-surface temperatures drop and outgassing when temperatures rise.
Question 10: Why does CO2 never drive temperature in the past, but now it does?
Question 11: Why don’t remote stations show warming?
The urban heat island effect is caused by the built environment retaining heat during the day and releasing it at night, causing nighttime temperatures to rise. This has been going on for 200 years already, and all scientists are aware of it. But when you remove urban and suburban thermometer readings, you don’t see any warming. Here are two examples:
The USCRN dataset for the contiguous US includes data from only remote stations. Here’s the result since 2005:

Worse, the US Historical Climate Network has data going back to around 1900 for many stations. I’ve written a thorough review showing only the slightest of trends upward since 1900, but here are just two very remote stations showing daily max temps since the late 1800s:


Question 11: Where’s the warming? Could it be manufactured by people who have an agenda, so they just show temperatures under the influence of urbanization?
Question 12: The last interglacial was warmer. Why is this one special?
Before you say “Because now we have so much CO2!,” you should understand that this is not causative reasoning. If your theory doesn’t explain how the Eemian interglacial got so much hotter than today, you can’t run around saying it must be the CO2 because now it’s so very hot.

The Eemian period (130k - 115k years ago) is the last interglacial period, when temperatures reached a peak of around 4.3 degrees C above today’s. During that time, CO2 went from 250 parts per million (technically a CO2 famine, as only a few plants can survive under those conditions) to around 320 parts per million. It’s easy to explain this - it’s the result of Henry’s law, which describes CO2 coming out of the oceans as temperatures rise.
Remember that the physics can’t change.
Question 12: How did temperatures rise 4 degrees C higher than today, even though CO2 levels were much lower?
Question 13: Does solar variance matter?
This question comes from Andy May:
The IPCC assumes that the radiative forcing for a doubling of CO2 from 1750 levels is 3.9W/m2 or less and that the climate impact of this forcing change is roughly equivalent to a change in solar forcing of 3.9 W/m2. But a 3.9 W/m2 change in greenhouse gas emissions from the atmosphere in the infrared frequencies cannot penetrate the top millimeter of the ocean. Thus, it has a different impact than a 3.9 W/m2 change in solar radiation, part of which penetrates hundreds of meters into the ocean, where it is fully absorbed.
Javier Vinos has shown that solar variance can be responsible for the temperatures we have experienced. As I show in my article, What heats the oceans?, if CO2 can’t affect ocean heat, and half the incoming solar energy goes into the oceans directly, how is ocean heating insignificant?
Question 13: How sure are you that the sun’s impact is neutral? Is it because you’ve heard it many times, or that you’ve investigated and found it to be true? What evidence do you have that incoming solar radiation doesn’t change over decades and centuries?
Question 14: Can you account for all the energy transported from the tropics to the poles?
At all times, 180 pW of energy strikes the Earth. 30 percent is reflected away (this is called albedo), so 120 pW lands on earth. Of that, 11 percent makes its way from the tropics to the poles to be released as infrared heat. This 11 percent, or roughly 12 pW, drives all the weather outside the tropics. It creates the heat gradients that drive the cells, the jets, the storms, the vortex, and the ocean currents.
Question 14: What happens to the 12 pW of solar energy that goes directly into the oceans? Where does it come out and go to space? How is that affected by CO2? Again, be precise in your explanation of how CO2 affects ocean temperatures that drive our weather systems.
Question 15: What explains the increase in outgoing longwave radiation?
If the earth is heating because of an increase in the greenhouse effect, then the earth is “trapping” more longwave radiation before it can escape to space. So for a net heat gain, there must be a corresponding reduction in longwave radiation going to space.
But that’s not what is observed. According to this 2022 peer-reviewed article, satellites detect not a reduction from the ground up but rather “reductions in the amount of sunlight scattered by Earth's atmosphere.” They conclude, “Thus, models that match the global shortwave change do so for the wrong reasons.” See several more papers on albedo.
Question 15: How does the greenhouse gas theory square with the evidence that albedo has increased since 2000?
Question 16: How long are the ocean cycles?
The AMO is a 65-year cycle. Does it correlate with temperatures better than CO2 does?
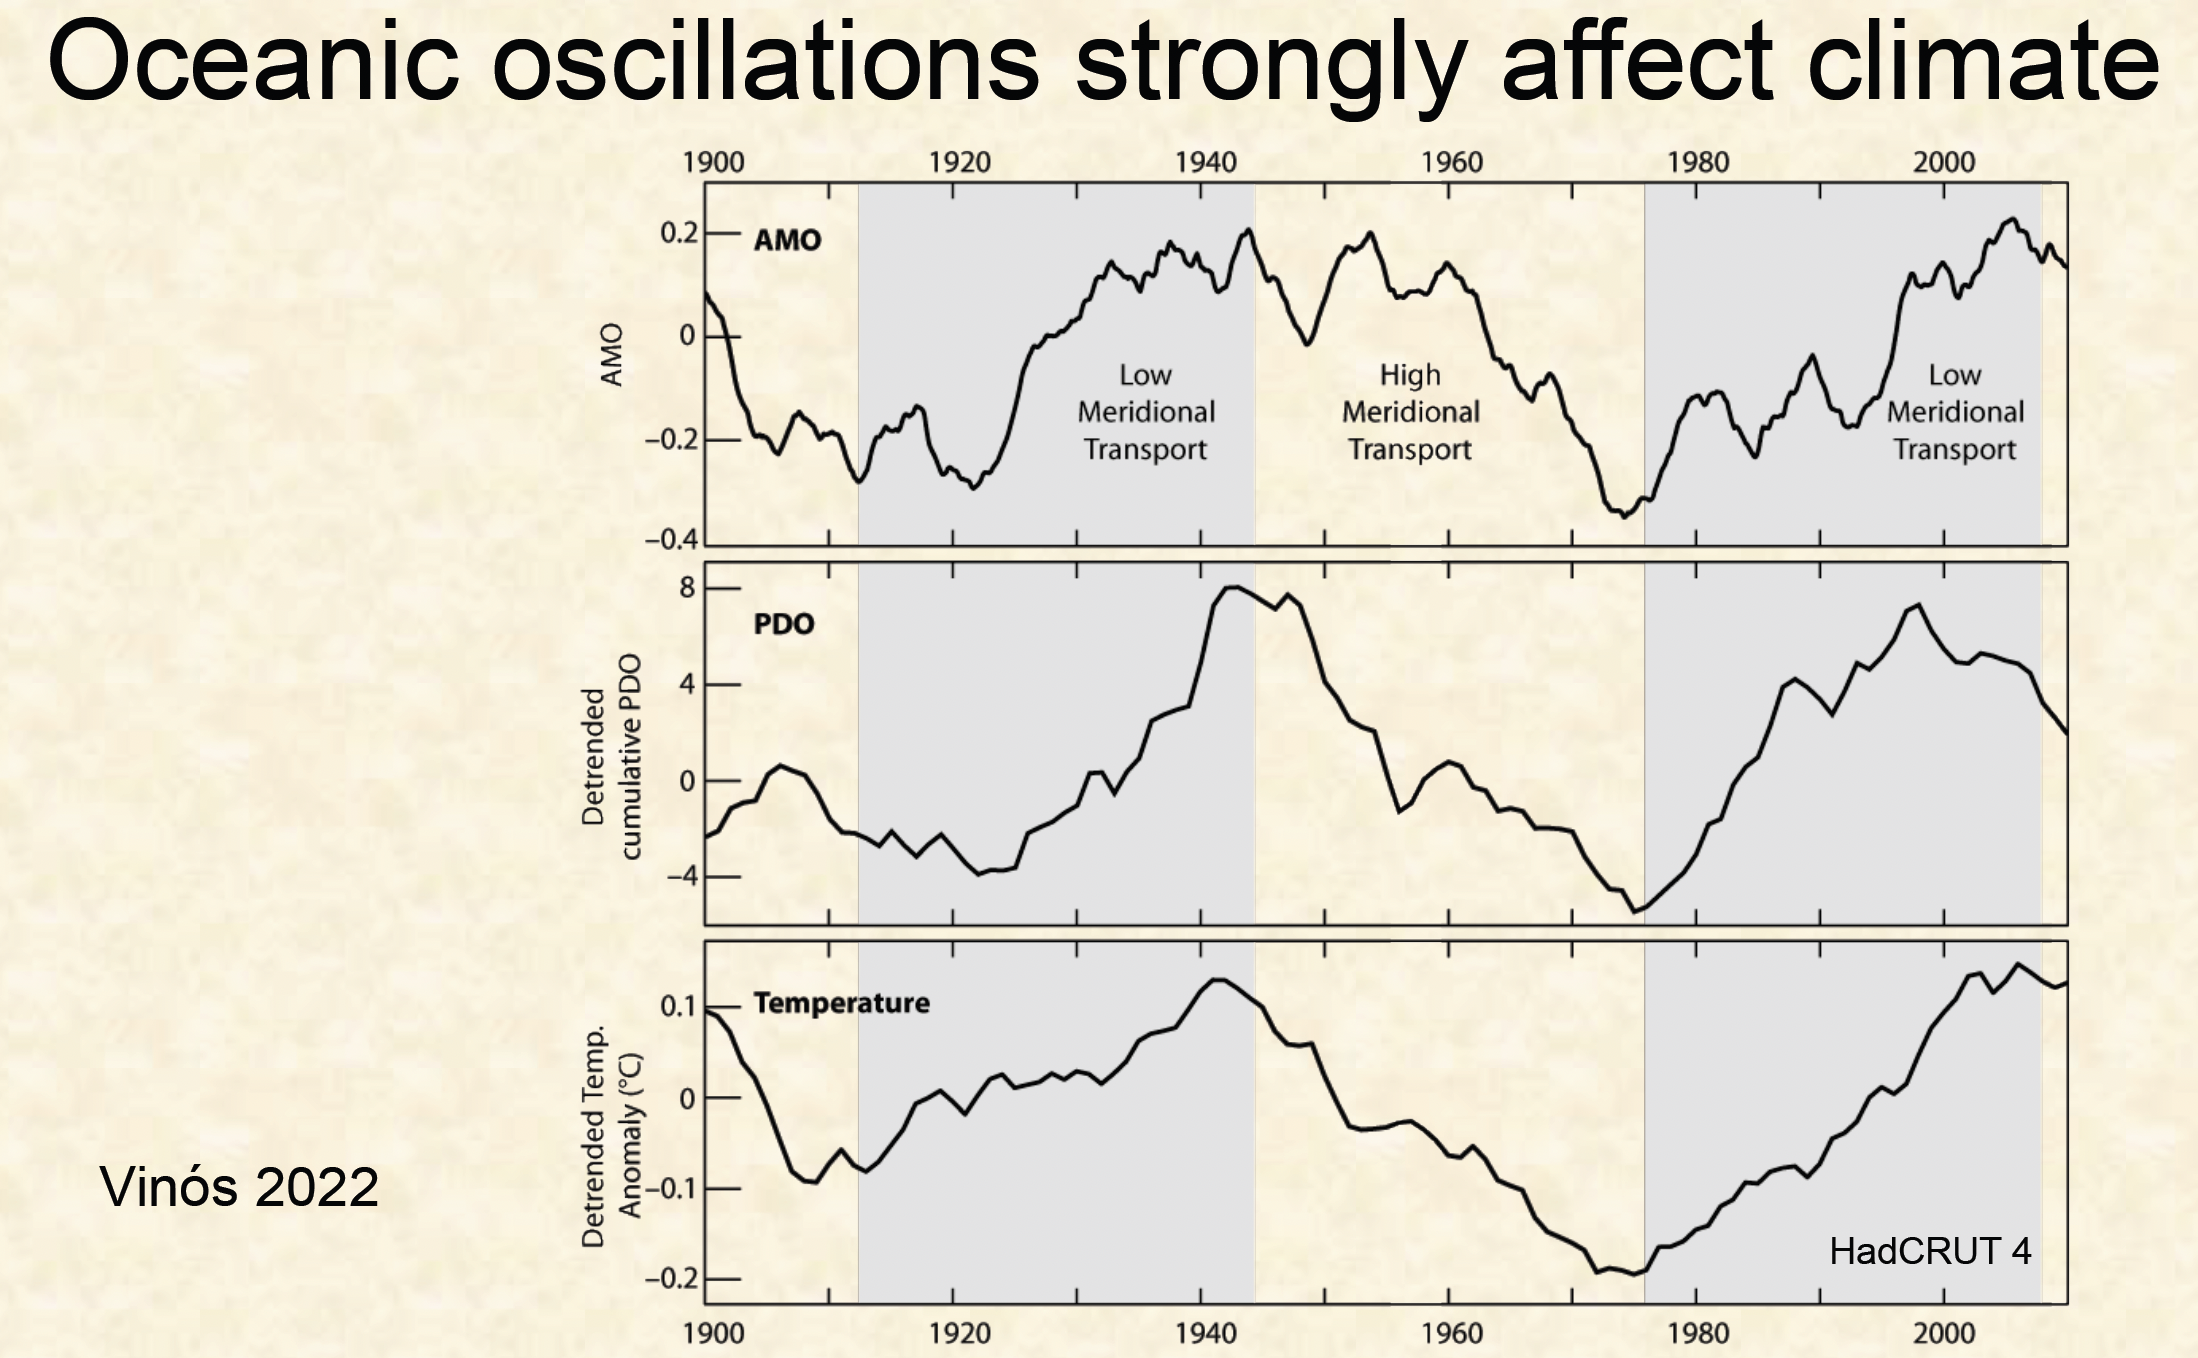
Question 16: Explain how CO2 drives climate in a world where ocean oscillations correlate strongly with temperature.
Question 17: Why haven’t the tropics warmed?
Well over half of the total radiation Earth receives is in the tropics, yet tropical temperatures hardly change over time. Let’s look at CERES trend data for 20 years:

CERES data. Plot by Willis Eschenbach.
Note that for 20 years the tropics have no trend. This can be seen in other data. There’s always plenty of water vapor to keep overnight temperatures from dropping. But if CO2 is responsible for all the other temperature gains, why has it spared the tropics? Here are the specific questions, remembering that CO2 is a well mixed gas:
Question 17: Why does CO2 have so little effect on tropical temperatures, where the sunlight (and therefore the greenhouse effect) is greatest?
Question 18: Why doesn’t CO2 drive temperature on the East Antarctic plateau?
Watch this short video:
Question 18: Why don’t temperatures on the East Antarctic plateau respond to CO2 the way you claim they have elsewhere?
Question 19: Why is Antarctica gaining ice?
Antarctica’s ice-mass balance has been increasing since 2020 at an average rate of about 68 gigatons per year. That’s because more snow has fallen on top than has calved off into the oceans — this is business-as-usual for Antarctica, which has been slowly gaining ice for centuries, and the reason that the McMurdo station at the South Pole is built on stilts, so they can keep raising it as the snowpack rises. See the peer-reviewed literature on Antarctica. “Scientists” claim this is from “a warmer world,” but they don’t talk about the relentless rise of Antarctic ice over thousands of years.
Question 19: How does increased CO2 suddenly change the equation in Antarctica? How is this not business as usual for Antarctic ice?
Question 20: Why shouldn’t we be trying to remove water vapor from the atmosphere?
Governments are currently spending tens or hundreds of billions on projects to remove CO2 from the atmosphere, yet everyone knows water vapor does at least 4 times as much work of the greenhouse effect than CO2 does. Why don’t governments want to pay to remove water vapor?
If your answer is “because the oceans will just equilibrate,” think about that for a second. If you still believe we should be trying to remove CO2 from the air, think a bit more.
Question 20: Why do you think we should spend any money at all removing CO2 from the atmosphere? Be very specific in your answer and address the equilibration via Henry’s law.
Question 21: What’s up with hurricanes?
Here is the number of recorded hurricanes since 1860 (blue line) along with the number probably missed due to poor counting methods:

The data comes from the National Hurricane Data Center. Their blog asks whether CO2 from humans is causing more hurricanes. Their conclusion:
Therefore, in summary, we cannot yet say with confidence whether there is any detectable human influence on past Atlantic hurricane activity, and this is particularly the case for any greenhouse gas-induced changes. A temporary period of decreasing man-made aerosol emissions likely contributed, along with natural variability, to increased Atlantic hurricane activity since 1980, although its relative contribution remains uncertain.
Question 21: Why do you think humans are causing more hurricanes? What data supports this?
Question 22: What would falsify your belief in the CO2 hypothesis?
Anyone who says humans causing dramatic climate change is a “fact” or “settled science,” doesn’t know anything about science.

In science, there are hypotheses, theorems, and laws. Even laws get modified as we learn more information. The law of gravity, for example, doesn’t hold at very small scales. There’s still a lot we don’t know about gravity.
So most serious scientists who are not on the payroll as marketers would say that CO2 having a measurable or impactful or “catastrophic” effect on climate is an hypothesis. The question, then, is: “What would you have to learn to discard your hypothesis?” So far, the IPCC, NASA, and many other government agencies have not answered this question. CO2 seems to be able to do everything.
What would I have to learn to agree that CO2 is causing our climate to change? That’s easy. I would want to see that it has done so many times in the past and there is a strong correlation for, at the very least, 50 million years. Second, I’d need different answers to the questions above that show that CO2 is the driver. If I saw that, I’d publicly reverse my position and join the UN in declaring that the world is on fire and we must decarbonize.
Question 22: What about you? What would cause you to reverse your view on CO2 and climate?
Conclusion
I actually have a lot more of these questions, but I haven’t had time to put them here. It should be clear from this and other resources on this website that CO2 is not a threat, CO2 is not having any effect on our climate, and that the sun is the ultimate driver of climate on planet earth.
Future historians will write: “They had a warm period, and they squandered it.” But ultimately, the first question is the most important:
Why do you think zeroing out carbon is more important than zeroing out poverty?
If you have an answer for that, get in touch. I’d love to interview you about it. So far, no one has.