
The climate quiz
See what you know about the earth’s climate …

Most of my friends believe they are experts in climate and can tell cause from effect. Here’s your chance to prove it! Here are 50 easy to medium-hard questions that most serious climate experts can answer quickly, without looking them up. Number your page from 1 to 50. Write down your answers, then check against the answers revealed at the end.
I’m going to start with a warm-up question and answer it ...
What is climate?
A) Changes in extreme weather events.
B) Changes in local temperatures.
C) Changes in local or global temperatures and conditions that occur on a timescale of at least 30 years.
D) Changes in the overall annual number of fires, floods, snowfall, heatwaves, droughts, etc.
E) None of the above.
Choose your answer before continuing.
The correct answer is C. Any trend on a timescale of less than 30 years is not climate. So if you heard that, say, arctic sea-ice extent had decreased over 20 years, that would not be an indicator of climate, because it could just as easily reverse and increase for the next 20. If you hear temperatures have been rising for ten years, that’s not climate. Floods, hurricanes, wildfires — not climate. While some shorter-term trends are interesting, and climate scientists try to understand them, an effect has to occur for at least 30 years to count as a change in climate. Did you get that one? Good.
What is a scientist?
A scientist comes up with hypotheses and experiments to test those hypotheses, gathers data, tries to learn from the data, and if her data point to a particular cause for a particular effect, she spends years trying to disprove what she just thought she learned. Scientists are skeptical, especially of their own work. True scientists are particularly skeptical of experts and don’t take anything on face value — they have to figure it out for themselves. A true scientist wouldn’t sacrifice her professional integrity by doing something just for the money. A true scientist is intimately familiar with the writings of Richard Feynman and believes, as he did, that “you are the easiest one to fool.” A true scientist understands that it’s always about the details and the uncertainties. A person does not have to be paid to be a scientist, while many “professional scientists” who do get paid are not actually scientists. Above all, true scientists are never “alarmed,” ever. They are simply interested to learn more.
Now that we’re on the same page, here’s another warm-up question: The latest 2022 IPCC AR6 climate report has how many chapters?
Did you know the answer to that? If not, this could be challenging. You may want to take my climate class.
Part 1: easy questions
1. What percent of the earth’s atmosphere is CO2?
A) 40 percent
B) 4 percent
C) 1.4 percent
D) 0.4 percent
E) 0.1 percent
F) 0.04 percent
G) 0.01 percent
H) 0.004 percent
2. What is Earth’s energy budget in Petawatts?
A) 293PW incoming shortwave, 278 PW outgoing longwave
B) 60PW incoming shortwave, 57 PW outgoing longwave
C) 180PW shortwave, 60 PW shortwave reflected, 120 PW outgoing longwave
D) 34PW shortwave, 27 PW shortwave reflected, 6 PW outgoing longwave
3. How thick is the CO2 layer in the atmosphere?
A) About 1 cm
B) Less than 10 cm
C) Less than 30 cm
D) Less than 1 m
E) About 1,000 m
F) None of the above
4. Where is the CO2 in the atmosphere?
A) It’s a thin layer at the top of the troposphere, about 10km up.
B) It’s more concentrated at the top of the troposphere — there’s more as you go up.
C) It’s mostly in the stratosphere, above 10km.
D) CO2 is heavier than air. It’s mostly in the first kilometer above ground level.
E) None of the above.

5. In the graph above, what was the key factor causing the global troposphere temperature to spike in 2023-2024?
A) Reduced albedo
B) More solar flares
C) More CO2 emitted post-Covid
D) Mostly the Hunga Tonga volcano
6. At what CO2 concentration do commercial greenhouses operate for optimal plant growth?
A) Below 250 PPM
B) 250 — 500 PPM
C) 500 — 1,000 PPM
D) 1,000 — 1,200 PPM
E) 1,200 — 5,000 PPM
F) Above 5,000 PPM
7. What is the earth’s average surface temperature today?
A) 30 degrees C
B) 23.6 degrees C
C) 18.2 degrees C
D) 16 degrees C
E) 15 degrees C
F) 12.5 degrees C
8. What’s the best estimate for the earth’s average surface temperature 90 million years ago?
A) 30 degrees C
B) 28 degrees C
C) 23.6 degrees C
D) 18.2 degrees C
E) 16 degrees C
F) 14.5 degrees C
9. How much of the earth’s surface is covered by water?
A) 49 percent
B) 51 percent
C) 67 percent
D) 71 percent
E) 76 percent
10. If all the ice in the Arctic polar ice cap melted, how much would sea level rise?
A) 0 cm
B) 1 cm
C) 10 cm
D) 25 cm (1 foot)
E) 50 cm
F) 84 cm
11. The Intertropical Convergence Zone (ITCZ) is:
A) Where the Indian ocean meets the Pacific.
B) The climatic region around the equator.
C) The weather patterns that drive the Hadley cells
D) a belt of low pressure near the equator where the northeast and southeast trade winds converge.
E) None of the above
12. This NASA diagram:

is fundamentally wrong, because:
A) It doesn’t take meridional heat transfer into account.
B) It omits albedo.
C) The atmospheric window is too small.
D) The insolation figure is only valid at the equator.
E) The numbers don’t add up.
13. Here’s a diagram of the earth’s adiabatic lapse rate:
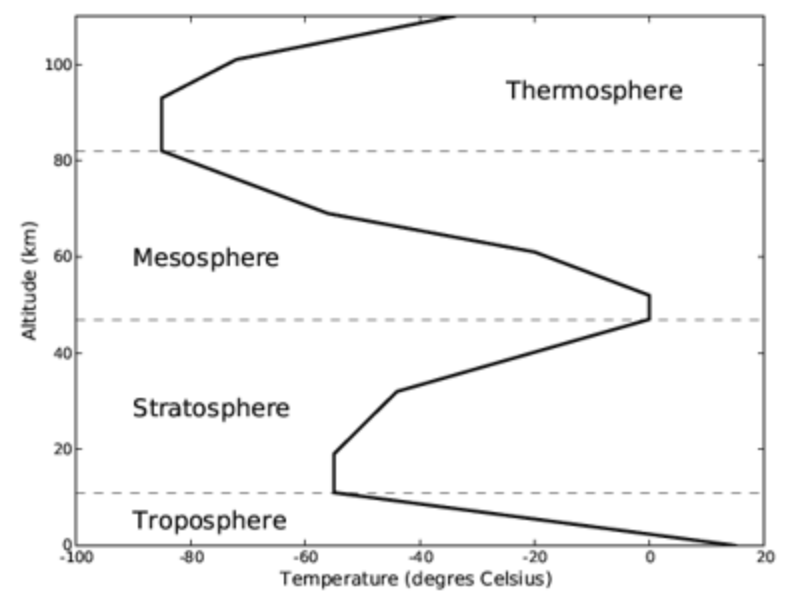
Everyone who studies climate is familiar with this. Temperatures at 50km can be the same as those below on the ground. Explain what’s going on in the stratosphere?
A) The stratosphere warms as you go up because of incoming cosmic rays.
B) The stratosphere has no clouds, so there’s more sunshine hitting the O2 and N2 molecules.
C) Incoming UV radiation creates ozone, which absorbs shortwave radiation. Higher concentrations of ozone occur 20-30km up. As UV light is stronger higher up, the warming effect is stronger at higher elevations.
D) Most ozone is at the bottom of the stratosphere, which is denser, so the ozone heats up and radiates heat to space. The radiative heating of air molecules and convective upward air movement creates higher temperatures as you go up.
E) High clouds in the stratosphere have a greenhouse effect that warms the stratosphere. The heat coming off the clouds accumulates as you go up.
14. According to the IPCC, the effects of greenhouse gas forcing on changes in atmospheric dynamic and associated changes in drought occurrence is …
A) High confidence
B) Medium confidence
C) Low confidence
15. According to the IPCC, general statements attributing changes in global flood events to anthropogenic climate change have:
A) High confidence
B) Medium confidence
C) Low confidence
16. According to the International Union for the Conservation of Nature, whose job it is to count polar bears, the number of polar bears on earth in 1960 was under 10,000. Roughly how many are alive today?
A) 6,000–8,000
B) 8,000–12,000
C) 12,000–16,000
D) 16,000–22,000
E) 22,000–32,000
F) 32,000–40,000
G) 40,000–50,000
17. What caused very high US temperatures in 1998 and 2016?
A) Wet conditions in the South Pacific.
B) Bad farming practices.
C) The rising amount of CO2 in the atmosphere.
D) The AMO.
E) The PDO/ENSO.
18. Approximately how warm were temperatures in the Medieval Warm Period (900 - 1300 AD)?
A) Fake question. This is referred to as the Medieval Ice Age, everyone knows it was much colder then.
B) Less than today’s temperatures by about 2 degrees C
C) Less than today’s by about 1 degree C
D) About the same as temperatures today
E) Significantly warmer than today by at least 1 degree C
19. What role do clouds play in the atmosphere?
A) They provide the tipping points that heat the earth to extreme levels.
B) Troposphere (lower-atmosphere) clouds generally reflect heat during the day and retain heat at night, while stratospheric (upper-atmosphere) clouds are made of ice and reflect sunlight away.
C) Water-rich low clouds over the tropical ocean have the greatest cooling effect and low-water ice clouds at high altitudes have the strongest warming effect. Overall, the cooling effect is greater.
D) Troposphere (lower-atmosphere) clouds greatly accelerate the greenhouse effect of CO2, while stratosphere (upper-atmosphere) clouds have no effect on temperature.
20. What’s the general trend of precipitation in the continental US over the last 60 years?
A) Unusually wetter than the previous 60 years.
B) Generally wetter than the previous 60 years.
C) About the same.
D) Generally drier than the previous 60 years.
E) Remarkably drier than the previous 60 years.
21. What has been the trend of Arctic sea-ice extent for the last 15 years?
A) Significant decrease
B) Gradual decrease
C) Flat
D) Increase
E) Significant increase
22. What is the polar vortex?
A) The polar vortex has little to do with climate but is responsible for the Northern Lights.
B) The polar vortex is a circular band of strong westerly winds in the stratosphere between about 10 and 30 miles above the northern polar region from about 65 degrees N to the pole, is strongest in winter, and can lose energy and change the jetstream. While the Northern polar vortex has more impact on humans, there is also a Southern polar vortex.
C) The polar vortex is a band of fast-moving cold air in the upper troposphere. It is where jets fly.
D) The polar vortex is an irregular pattern of air above the north pole caused and influenced by greenhouse gases. It has grown tremendously in the last 50 years.
23. The lowest 10km or so of the atmosphere is called the:
A) Atmosphere
B) Mezosphere
C) Lithosphere
D) Stratosphere
E) Troposphere
24. The earth’s albedo is roughly:
A) 1 percent
B) 8 percent
C) 18 percent
D) 30 percent
E) 44 percent
F) Nonexistent. Venus has an albedo, but earth doesn’t.
25. The water in the earth’s atmosphere originally came from:
A) Deep underground.
B) Space. Water is relatively abundant in space.
C) It was created by heat and pressure on oxygen and hydrogen molecules.
D) It precipitated out of the original rocks.
E) None of the above.
26. The CO2 in the earth’s atmosphere originally came from:
A) It was manufactured by animals breathing in oxygen supplied by plants.
B) It was created deep in the earth and came out through volcanoes.
C) Mostly from decaying plant and animal material buried underground.
D) Space. CO2 is fairly common in space.
E) None of the above.
27. What phase is the Atlantic Multidecadal Oscillation in now?
A. Neutral
B. Warm
C. Cold
D. None of the above, that’s not how the AMO works.
28. What solar cycle are we in now?
A) 18
B) 22
C) 23
D) 24
E) 25
F) 26
G) Solar cycles use names, not numbers.
29. These maps use data from the US Historical Climate Network:

One of these maps shows data from 1936, the other from 2023. Which is which?
A) The data is all faked and cherrypicked, it’s not from the USHCN.
B) A is 1936.
C) B is 1936.
30. According to NOAA’s tide-gauge network, the rate of sea-level rise since 1800 is:
A) Accelerating
B) The same
D) Slowing down
31. Since 1968, temperatures have generally been rising. Has the rate of that rise generally:
A) Accelerated - the temperature curve is going up and bending upward even more
B) Been flat, no acceleration, linear increase
C) Declined - the temperature curve is going up but bending downward
D) We don’t know, there’s too much uncertainty in these measurements.
32. Recorded temperatures in Adelaide, Austrailia:

One of these shows the temperature record for 1920, the other for 2020. Can you tell which is which?
A) The gray one is obviously 1920.
B) The orange dotted one is obviously 1920.
C) I can’t tell.
D) This is ridiculous. It’s totally fake data.
Part II: Intermediate questions
33. How does the greenhouse effect work?
A) Where the lapse rate is positive, it delays longwave photons as they escape, raising the emission height and shifting the curve toward higher surface temperatures; where the lapse rate is negative, it accelerates the escape of longwave radiation and shifts toward lower surface temperatures.
B) It’s pretty much exactly like a greenhouse — it reflects heat back down to earth that would otherwise escape.
C) It concentrates more heat in the oceans.
D) Same as A but without the negative pole nonsense.
E) It’s not like a greenhouse, it’s like a blanket, trapping heat. CO2 is an insulator.
F) None of the above
34. According to a 2022 blog post by Chris Landsea and Eric Blake at the National Hurricane Center in Miami, the number of hurricanes has risen from 1878 to today because …
A) CO2 added to the atmosphere by humans
B) A combination of CO2 and natural factors
C) Better determination and counting methods
35. According to Our World in Data, total cyclone energy, which is a measure of all cyclone strength per year combined, after adjusting for technology and measurement bias, has …
A) Risen dramatically in the last 20 years
B) Risen a bit
C) Been flat
D) Oscillated up and down over a 50-year cycle with no discernable difference between the end of the 19th century and early 21st.
E) Trended down consistently
36. About 38,000 years ago, in the largest Dansgaard-Oeschger event #8, north Atlantic temperatures rose dramatically over a period of less than 120 years. According to a 2014 peer-reviewed investigation, how big was the temperature rise?
A) 1–2 degrees C
B) 2–4 degrees C
C) 4–8 degrees C
D) 10–13 degrees C
E) 15–17 degrees C
37. According to a peer-reviewed article in the journal Cryosphere, from 2009 to 2019, Antarctica’s ice shelves …
A) Lost 2,500 GT of ice
B) Lost 844 GT of ice
C) Have been stable
D) Gained 661 GT of ice
E) Gained 1744 GT of ice
38. According to a 2021 paper analyzing Greenland’s mass balance from 1992 - 2020, Greenland shed approximately 200 gigatons of ice per year, causing global sea level to rise by 0.4 millimeters per year. At this rate, how much will Greenland cause sea level to rise by 2100?
A) 40mm = 4cm = less than 2 inches
B) 400mm = 40cm = 16.75 inches
C) 4,000mm = 400cm = 13 feet
D) 10,000mm = 10m = 33 feet
39. Has the Arctic Ocean been essentially ice-free in summer in any time during the past 10,000 years?
A) No; the last time the Arctic was ice-free was about 90 million years ago.
B) No; there was less ice 8,000 years ago, but no, not ice-free in summer.
C) Absolutely. In fact, the Arctic sea was ice-free in summer for a few decades in the 1600s.
D) Probably; the best studies we have point toward very little ice, and possibly no summer ice for hundreds of years in the range 6,000 — 10,000 years before present.
40. This is a MODTRAN database graph showing the frequencies at which CO2 and methane are most effective as a greenhouse gas under clear skies. What does it say?

MODTRAN data visualization by William Happer
A) That CO2 is rising over time.
B) That CO2 went down 600 years ago and has now peaked.
C) That doubling CO2 will have a negligible effect on the emissivity and, therefore, surface temperatures.
D) That doubling CO2 will block all the energy shown by the black curve.
E) That with no CO2 the earth would be 360 degrees cooler (green line).
41. What is the difference between the calculated Equilibrium Climate Sensitivity and the Transient Climate Response?
A) The ECS takes years, while the TCR takes decades.
B) The ECS hasn’t changed since the original Charney report, but the TCR is much more dramatic as a result of modeled feedbacks.
C) The ECS is based on CO2 densities in the troposphere, while the TCR includes the stratosphere.
D) The ECS models the instantaneous doubling of CO2 after a period of coming to equilibrium, and the TCR models the response to increasing 1 percent per year until CO2 is doubled.
42. If we could instantaneously double the amount of methane in the atmosphere from 2 parts per million to 4 parts per million, how much would that raise the surface temperature?
A) About 1-2 tenths of 1 degree C.
B) About a half of 1 degree C.
C) About 2.5 degrees C.
D) About 5 degrees C.
E) About 10 degrees C.
43. This is a record of all max temps in Parker, Arizona (a very remote weather station) since 1893.

What story does this tell?
A) In this location, temperatures have been rising dramatically.
B) In this location, temperatures have been relatively steady for 130 years.
C) In this location, temperatures have fallen.
44. Is this (see previous question) station anomalous?
A) Yes, most thermometers around the US show a dramatic rise in temperatures, including most rural stations.
B) No. This station represents the vast majority of rural stations recording since the early 1900s.
C) Rural and urban weather stations report substantially the same temperature trend for the entire period, and this is representative.
D) Rural and urban weather stations report substantially the same temperature trend for the entire period, and it doesn’t look anything like this.
45. Here’s data from a very remote weather station in Iceland that has been recording temperature since 1798:

How much warming does it show in 217 years?
A) About 6 degrees C.
B) About 3 degrees C.
C) Less than 2 degrees C.
D) About 0.2 degrees C.
46. What does this graph show?

A) The Roman Warm Period, which was about as warm as temperatures are today, followed by a bit of cooling, then the Medieval Warm Period, during which temperatures were as high or higher than today (Greenland was settled then, and they grew corn, which can’t grow there now), followed by the very cold Little Ice Age, and now 200 years of natural warming continuing the cycle.
B) This graph is fake, fake, fake. There are no peer-reviewed scientific articles that support this graph.
C) This is only European temperatures. The rest of the world didn’t do this.
D) That temperatures now are far higher than any point in the last 200,000 years.
47. What happened 33 million years ago?
33 million years ago, temperatures fell off a cliff and the poles went into a deep freeze. What caused this?

A) A sudden rise in oxygen concentration.
B) Sunspots stopped for a period of about 1 million years.
C) Trees took over the landscape, sucking in all the CO2.
D) Mammals flourished, providing more CO2.
E) The Southern Ocean circumpolar current started.
F) An asteroid.
48. The Keeling Curve is in a sawtooth pattern because:
A) The measurement is taken at aphelion (earth farthest from the sun), then perihelion (closest to the sun). The distance to the sun accounts for the discrepancy.
B) In each hemisphere, plants suck in CO2 during spring and summer as they grow, reducing atmospheric CO2; then in fall and winter, they “exhale” carbon as leaves fall and forests decay, increasing CO2 in the atmosphere.
C) Robert Keeling designed his instruments to detect very small perturbations in CO2; the record reflects tiny oscillations caused by the difference in cosmic-ray flux at that altitude. The curve should be seen as essentially smooth.
D) The curve reflects macro-scale climactic conditions at the latitude of the recording station.
Part III: Advanced questions
49. The most influential Milankovitch factor for earth’s climate today over the past 800,000 years is:
A) Eccentricity
B) Obliquity
C) Precession
50. Le Chatelier’s principle states that:
A) In physics, most feedbacks are positive.
B) In physics, most feedbacks above the Planck scale are negative.
C) Water at the Equator flows west as a result of the earth’s rotation.
D) In natural systems, most feedbacks are negative.
D) None of the above.
Thank you for taking my climate quiz! Go compare your written answers with the real answers. You can learn more answers by exploring this website. Please send your friends to ClimateCurious.com.